
I’m going to level with you most people glance at market Dow Jones headlines and bounce. They catch the number, wonder if they should panic, then scroll past. But that’s not how actual wealth works. You need to understand why the Dow Jones moves, not just whether it went up or down.
I’ve been following these markets for years, and honestly? The noise is incredible. Everyone’s shouting their take, but the signal’s buried underneath.
So I’m breaking down what actually matters about today’s market updates and how to read between the lines instead of trusting whatever some financial news anchor’s yelling about.
The Dow Jones Isn’t Really “The Market” (And That’s Important)
Here’s the thing nobody tells beginners: when people talk about Dow Jones index performance, they’re basically looking at 30 huge companies. That’s it. Apple, Microsoft, Coca-Cola, Goldman Sachs, and others thirty total.
The S&P 500 has 500 companies. The Nasdaq tracks tech-heavy stocks. But the Dow gets all the attention because it’s old, prestigious, and honestly kinda arbitrary. Those 30 companies definitely matter, but they don’t represent the whole market. Far from it.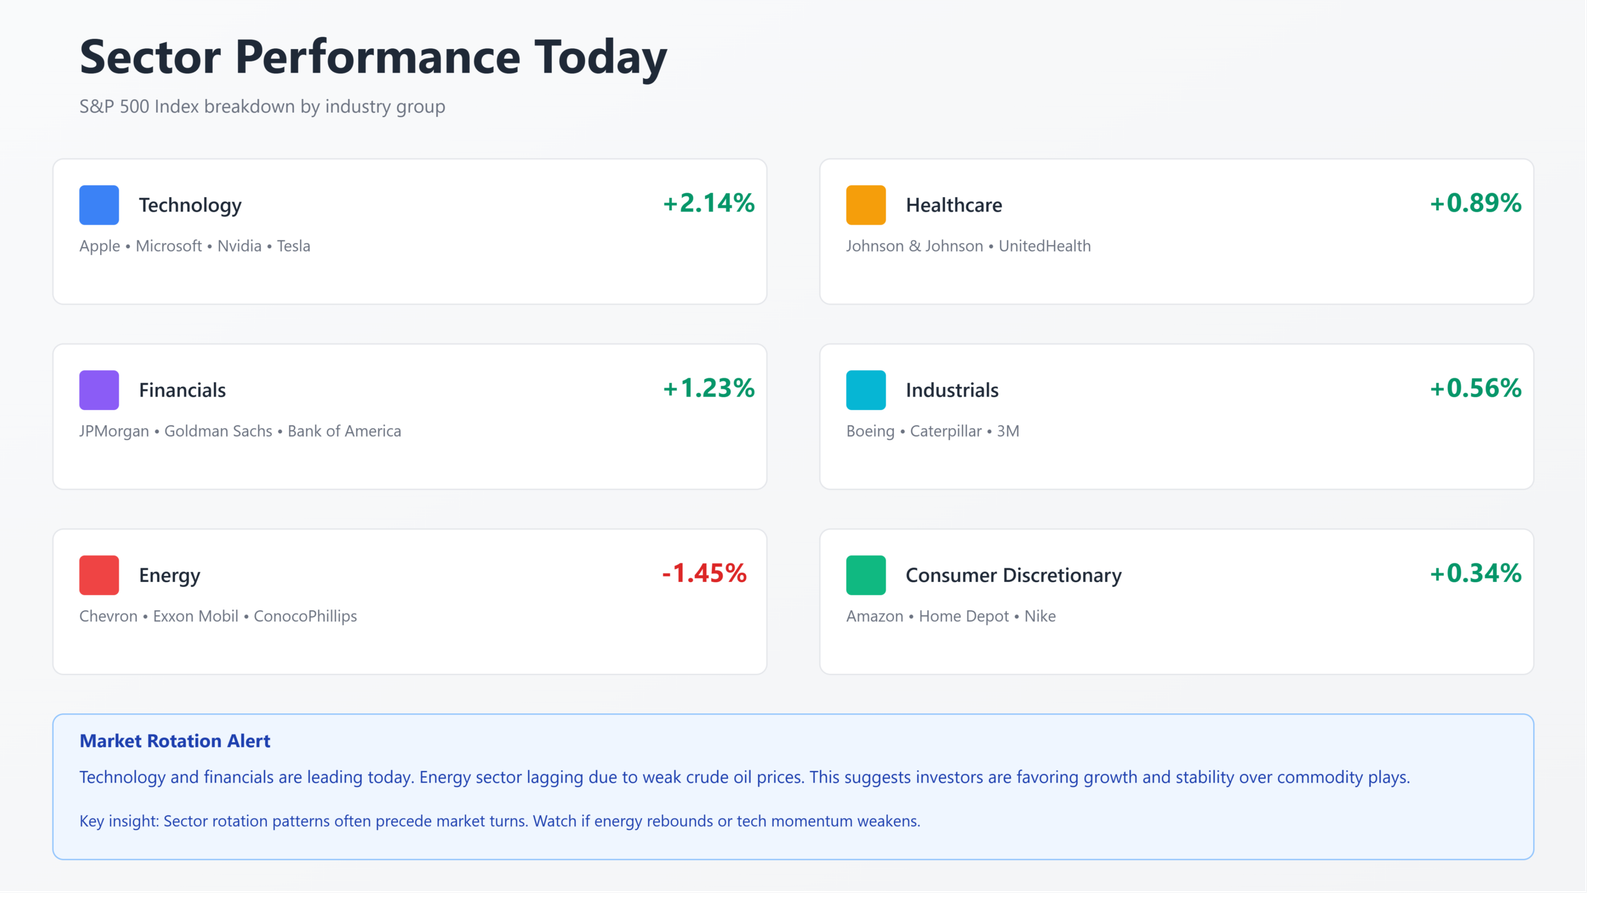
I’ve watched clients freak out because the Dow dropped 200 points, not realizing the companies they actually own—smaller caps, some tech, some energy moved completely differently. The Dow Jones is a snapshot, not a crystal ball. Don’t mistake it for the whole picture.
Why the Dow Jones Even Exists (A Quick History Nobody Remembers)
Back in 1896, Charles Dow and Edward Jones decided to track 12 big industrial stocks. They wanted one number that represented the economy’s health.
Over time, it became this symbol of stability and American prosperity. Banks watch it. Politicians cite it. When the Dow hits a new high, people think the economy’s booming. When it crashes, everyone assumes catastrophe’s coming.
The weirdest part? It’s price-weighted. Meaning a $300 stock influences the index more than a $50 stock, regardless of market cap.
That’s nuts by modern standards, but tradition’s hard to kill in finance. So when you’re watching Dow Jones updates, you’re kinda watching a legacy metric that matters mostly because people think it matters.
How Today’s Markets Actually Work: The Real Mechanics
Trading today isn’t humans shouting on a floor anymore. It’s algorithms and hedge funds moving millions in milliseconds. The Dow opens at 9:30 AM Eastern, closes at 4 PM. Between those hours? Absolutely chaotic.
Most trading volume happens in the first hour and the last hour. Morning rush? Everyone reacting to overnight news and premarket movement. Afternoon close? People settling positions before tomorrow. The middle of the day’s usually slower this is when you see moves that actually matter versus noise.
I’ve noticed intraday volatility depends heavily on Fed news, earnings reports, or geopolitical stuff. If nothing major’s happening, the Dow tends to meander. But release a jobs report or a central bank statement? Buckle up. Markets swing hard when new information hits.
What Actually Moves the Dow Jones (And What Doesn’t)
Let’s be real about what drives index movement. Corporate earnings matter massively. If Microsoft reports earnings that miss expectations, the whole index feels it Microsoft’s weighted heavily. Same with Apple, JPMorgan, Coca-Cola.
Federal Reserve policy might be the single biggest mover. Interest rate decisions ripple through everything. Higher rates make bonds attractive, which can pull money out of stocks. Lower rates let companies borrow cheap, which boosts growth. The Fed announces something unexpected? The Dow whips around.
Inflation data gets attention too. Hot inflation numbers suggest the Fed might hike rates further. Cool inflation numbers let people breathe. Oil prices matter because they affect shipping costs, energy stocks, and consumer spending. Elections create uncertainty, which creates volatility.
Here’s what doesn’t move markets as much as people think: individual political tweets, celebrity gossip about stocks, or some random pundit’s prediction. Social media makes this noise feel important, but real traders are watching earnings, rates, and macro data.
The stuff that seems huge on Twitter? Usually noise.
Understanding Today’s Market Updates: A Real Breakdown
When you’re checking Dow Jones news today, what are you actually looking at? Usually:
The opening number and percentage change. That’s the headline everyone sees first. But that’s basically useless by itself. You need context.
The biggest movers within the index. Which stocks dragged the Dow down? Which lifted it? This tells you if markets are panicking about specific sectors or if it’s broad-based movement.
Volume. Did the move happen on heavy volume or light? Light volume moves are weaker signals they might reverse quickly. Heavy volume moves? Those tend to stick.
Sector performance breakdown. Are financial stocks getting hit while tech rallies? That’s information. All sectors dropping? That suggests macro concerns.
The comparison to yesterday’s close and the year-to-date performance. One down day doesn’t matter. A pattern of down days does.
Honestly, I skip the clickbait headlines about what “caused” the move. Usually they’re guessing. Real analysis requires digging into the data yourself.
The Fed’s Role in Everything (It’s Bigger Than You Think)
The Federal Reserve sets interest rates. That’s basically it, but the implications are enormous.
Higher rates make borrowing expensive, which slows economic growth, which hurts corporate profits. That pressures stock valuations. Federal Reserve decisions ripple through the entire economy.
Lower rates do the opposite they’re cheaper to borrow, so companies expand, people spend more, profits rise. But loose money also creates inflation, which the Fed tries to manage.
Here’s my take: the Fed’s stuck between growth and inflation constantly. They can’t actually solve both simultaneously. They pick one, make it better, and the other gets worse. Markets spend years trying to guess which direction they’ll lean next.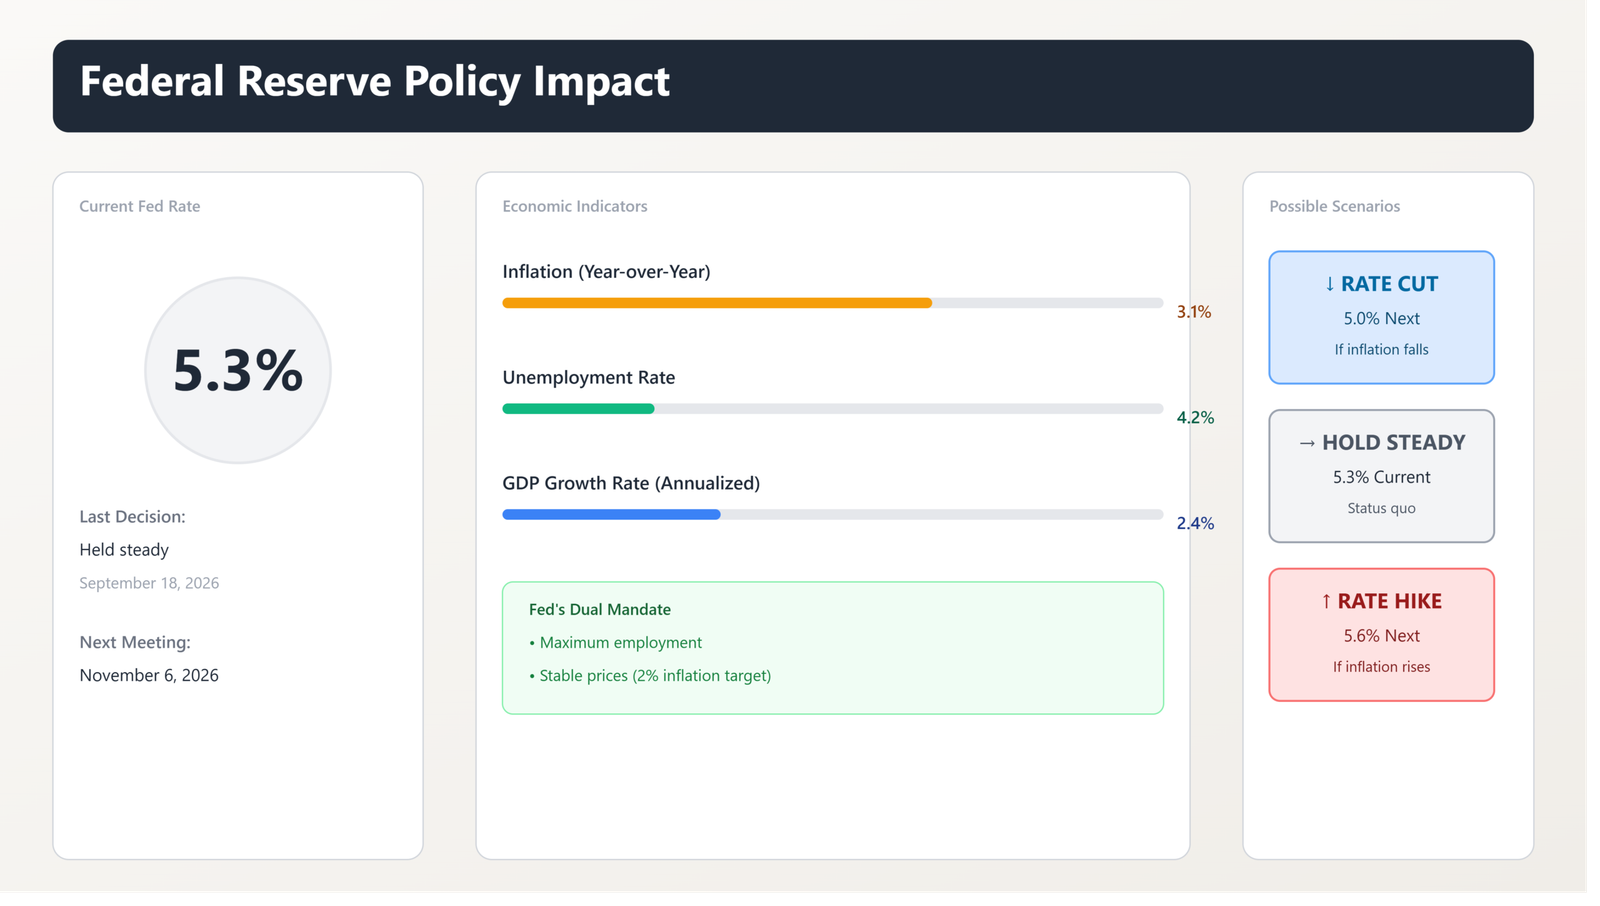
I’ve seen markets spike 400 points on a Fed announcement, then give it all back once people really digest what it means. Initial reaction vs. actual reality? Often completely different.
Today’s Economic Backdrop: Why Timing Matters Right Now
Where we are in the economic cycle affects how to interpret Dow Jones movements. Are we heading into recession? Expanding growth? Stagflation?
Right now, we’re in this weird spot where inflation’s still above the Fed’s target, but growth’s slowing. That creates tension. The Fed wants to cut rates to help growth, but cutting rates too much brings inflation back. So they’re moving slowly, watching data closely, trying not to screw it up.
This environment means stocks bounce around a lot. Some days the Dow’s up 300 because someone thinks recession odds are lower. Other days it’s down 400 because inflation data came in hot. The underlying situation doesn’t change much day-to-day, but market psychology does.
I’ve found it’s way easier to watch macro trends than try to guess daily moves. Focus on whether growth’s accelerating or slowing. Watch if inflation’s trending up or down. That’s the real story. The daily noise? Usually just noise.
Reading Market Sentiment (The Stuff Between the Numbers)
Markets are driven partly by fundamentals (earnings, rates, growth) and partly by sentiment (how scared or greedy people feel). Today’s market updates reflect both.
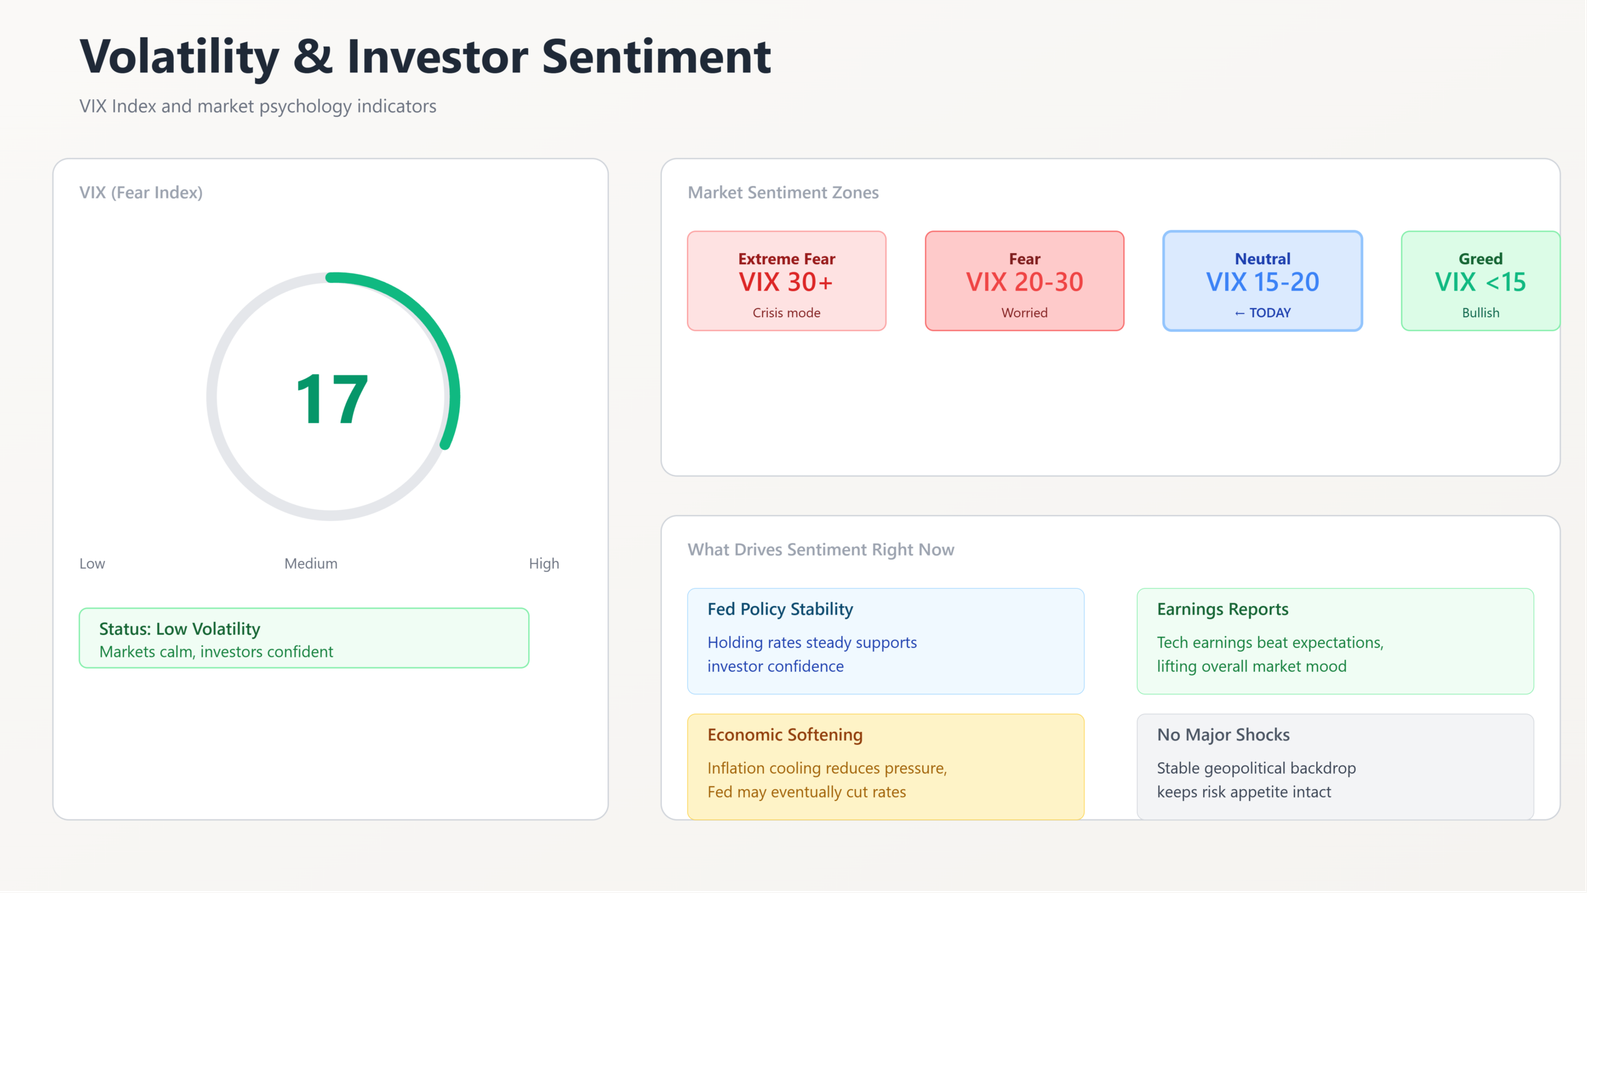
The VIX that’s the “fear index”tells you how nervous people are. High VIX means markets think things could get messy. Low VIX means people are relaxed. When the Dow’s down but the VIX is low, it suggests the selling’s orderly, not panic. Dow’s down with VIX spiking? That’s panic.
Breadth matters too. Are most stocks in the index up or down? If the Dow’s slightly up but 20 of the 30 stocks are down, that tells you the move’s driven by a few heavy hitters, not broad strength. Breadth breaking down often precedes index breakdowns.
Put/call ratio shows if traders are buying protective puts (expecting drops) or calls (expecting gains). Heavily skewed puts? Markets nervous. Heavy calls? Over-confidence is creeping in. The sentiment extremes are usually when reversals happen.
How to Actually Use Dow Jones Data to Make Decisions
Here’s what I tell people who want to use market data productively: don’t trade the daily moves. Seriously.
Your time horizon matters more than being right on any single day. If you’re investing 20-year money, daily index gyrations shouldn’t change your strategy. You’ll drive yourself insane trying to optimize around noise.
Watch the quarterly earnings seasons. That’s when you get real signals about where companies are heading. Watch Fed meetings those set policy direction. Watch unemployment and inflation data those shape economic reality. Those are the moments that actually matter for longer-term decisions.
For shorter-term traders which most people shouldn’t be, honestly the Dow tells you if risk appetite’s there or not. Strong Dow performance usually means investors are willing to take risk. Weak Dow? They’re getting defensive.
I keep a simple rule: big index changes get my attention, but I ask “why?” before doing anything. If there’s no real reason behind it (just computer trading or sentiment shifts), I wait. When there’s a fundamental reason (earnings miss, Fed action, economic data), I act.
Common Mistakes People Make Reading Market News
Everyone thinks they’re reading Dow Jones news objectively, but biases creep in everywhere.
One-day moves mean almost nothing, but headlines treat them like catastrophe or triumph. You’ll see “Markets Rally on Hope!” or “Stocks Tank on Recession Fears!” Same market, totally different narrative depending on whether it’s up or down.
People anchor to previous highs. The Dow was at 40,000 six months ago? They think we’re doomed at 38,500. But that’s how markets work they go sideways and up, with pullbacks. One down day doesn’t erase six months of gains.
Recency bias kills people. Last week was terrible? People assume next week will be too. Last quarter was great? They think next quarter will be great. Markets don’t work linearly. Trends persist, but reversals happen without warning.
Confirmation bias we read articles that agree with what we already think and ignore contradictions. If you’re bullish, you’ll find plenty of bullish takes. If you’re bearish, the bearish takes sound obviously correct. This is super dangerous because it prevents you from actually assessing risk.
Sectors Within the Dow: Where the Real Action Happens
The Dow contains a mix of sectors: financial services (JPMorgan, Goldman), technology (Apple, Microsoft), industrials (Boeing, Caterpillar), healthcare (Johnson & Johnson), energy (Chevron), consumer goods (Coca-Cola, Procter & Gamble), and others.
When the Dow moves, look at which sectors are driving it. If financial stocks are crushed but tech’s rallying, that’s telling you something different than if everything’s dropping together. Sector rotation is how professionals think about markets.
Financial stocks react to interest rates directly. Higher rates boost bank profits (they make more on lending), so financials often rally when rates rise. Tech companies prefer lower rates (cheaper to borrow for growth), so tech often suffers when rates go up.
Energy stocks correlate with oil prices. When oil’s expensive, energy stocks do well. Industrials do well in growing economies and struggle in recessions. Consumer goods are defensive they hold up when people get nervous because people still buy soap and soda.
Reading sector breakdowns tells you what markets are actually worried about. If tech’s tanking? Investors fear slowing growth. If financials are weak? They’re worried about rate cuts. This is way more useful than just knowing the Dow number.
Why Professional Investors Read This Differently Than You
Here’s something I’ve learned from talking to actual portfolio managers: they’re not looking at the same metrics you are.
When markets drop 2%, regular people panic. Professionals ask how much volume backed the move, whether breadth was weak, if bonds rallied (meaning it’s a flight-to-safety move) or stayed flat (meaning it’s just profit-taking). Context changes everything.
They watch the yield curve. How does the 2-year bond rate compare to the 10-year?
When short-term rates are higher than long-term (inverted curve), that’s historically suggested recession. This single relationship matters more than a thousand news headlines.
They track “smart money” flows where are big institutional investors actually putting capital? Retail investors are watching headlines. Institutions are watching order flow and tracking their peers’ moves.
They ignore most of what’s on financial news. They know it’s designed to keep people watching, not to provide alpha. Real analysis happens quietly in research departments, not on TV.
Technical Analysis: Does It Actually Matter?
Some traders swear by technical analysis reading chart patterns, support and resistance levels, moving averages. Others think it’s astrology.
Here’s my honest take: it matters more than skeptics admit but less than believers think. If a stock or index has consistently bounced off a certain price level, that level becomes real because traders treat it as real. Self-fulfilling prophecy, but still useful.
The 200-day moving average gets watched a lot. Stocks above it are in uptrends. Below it, they’re in downtrends. Simple, but it works surprisingly often. Support and resistance levels places where stocks have bounced or broken create patterns.
But here’s the catch: when the market’s in panic mode or euphoria mode, technical levels break. Fundamentals take over. So use technical analysis as a frame, not gospel truth. If the fundamentals are changing, charts won’t save you.
I’ve watched traders get wiped out because they trusted technical levels during earnings surprises or Fed shocks. Price moved through their level like it didn’t exist. Charts work best when fundamentals are stable.
The Dow vs. The S&P 500 vs. The Nasdaq: What’s the Real Difference?
People throw these three indexes around interchangeably, but they’re measuring different things.
The Dow Jones is 30 large-cap, established companies. It’s the most selective, least diversified.
The S&P 500 is 500 large-cap companies way more diversification. It’s probably the best single measure of the overall US market.
The Nasdaq is tech-heavy. It has thousands of stocks, but the biggest tech companies dominate it. Apple, Microsoft, Tesla, Nvidia move the Nasdaq more than smaller companies.
So when the Dow’s up but the Nasdaq’s down, that tells you small-cap tech is getting hammered while large-cap industrials and financials are fine. Different stories.
I track all three because they tell different stories. The Dow tells you about establishment blue chips. The S&P tells you about the broad market. The Nasdaq tells you about growth and tech sentiment. Together, they paint a complete picture.
How to Build an Information Diet Around These Markets
Reading market news constantly is usually worse than reading it occasionally. The noise drowns out the signal.
I recommend: check market data once per day (morning before market open or evening after close). You get the key numbers, the biggest stories, context for the week. That’s enough.
Skip the intraday moves. Seriously. Unless you’re day trading (which you shouldn’t be), knowing the market’s down 0.5% at 2 PM is useless information. It’ll probably bounce anyway.
Follow economic calendars. Know when the jobs report’s coming, when the Fed meets, when earnings seasons start. That’s when actual news happens.
Read one good source for analysis. Financial media is mostly noise. Find one writer or publication that thinks clearly and read their takes. Ignore the rest of the screaming.
Actually read earnings transcripts sometimes. See what management actually says, not what reporters claim they said. This alone puts you ahead of 90% of casual investors.
What “Buy The Dip” Really Means (And When It Works)
Market drops are normal. Most drops are healthy corrections, not catastrophes. This is why people talk about buying dips it usually works because markets have structural upside bias over time.
But here’s the reality: “dips” that preceded major crashes looked fine until they didn’t. 2008, 2020, 2022 all the big drops looked recoverable until suddenly they weren’t.
The safest approach: buy dips if you’re young and have decades to recover. If you’re near retirement, smaller dips are fine, but big draws sting. Risk tolerance isn’t about bravery it’s about your actual time horizon and capital needs.
Averaging in during dips beats trying to catch exact bottoms. Nobody gets those right anyway. Buying gradually as prices fall means you get better average prices without requiring prophetic powers.
What To Do When the Dow Crashes (The Psychology Part)
When markets drop hard, people panic. It’s biological. Losses hurt twice as much as gains feel good.
Here’s what I’ve seen work: have a plan before the crash. Decide beforehand what you’d do in a 20% decline, a 40% decline. If you know your plan, you’re way less likely to panic when it actually happens.
Remember: you haven’t lost anything until you sell. A down market means either your portfolio’s overvalued (which you should correct), or it’s undervalued (which you should be buying). Either way, panic selling is the move that actually locks in losses.
The hardest part about market corrections is resisting the urge to do something. Usually, the best move is sitting still and letting your strategy work.
Building a Personal “Dow Watch” System
Create your own system for tracking what matters. Mine looks like:
Every morning: check the Dow’s open, the S&P 500’s open, and the Nasdaq’s open. Five-minute snapshot.
Weekly: review sector performance, look at breadth data, check if bonds are rallying or selling off.
Every Fed meeting: read the actual policy statement. Skip the interpretation. Make your own.
Quarterly: review earnings results and what management says about forward guidance.
Annually: step back and ask if the macro picture has changed. Is growth accelerating or decelerating? Is inflation moving in the right direction?
This system takes maybe 30 minutes per week and gives you actual perspective instead of daily noise obsession.
The Uncomfortable Truth About Prediction
Everyone wants to know what the market will do tomorrow. Nobody can actually predict it consistently.
There are people who’ve done it once or twice and built entire brands on it. They got lucky and locked in the narrative. If you flip a coin 1,000 times, someone will get heads 10 times in a row. That doesn’t make them good at predicting coins.
Real investment success comes from:
- Having a strategy that makes sense
- Sticking to it through volatility
- Rebalancing when your allocations drift
- Keeping costs low
Not from predicting daily Dow Jones moves. Honestly, I wish more people accepted this. They’d stress less and make better decisions.
FAQs
Why does the Dow matter if it’s only 30 companies?
It’s a convenient barometer of large-cap sentiment and economy health. Professionals watch it because everyone watches it. The influence is somewhat self-fulfilling, but very real. Check the S&P 500 too for a fuller picture.
Should I panic if the Dow drops 300 points?
Only if something fundamental changed. One day of selling often bounces back. Wait 48-72 hours, see if it’s a genuine trend or just profit-taking. Unless your life situation changed, ignore it.
How do I know if today’s move is “good” news or “bad” news?
Ask why it happened. If the drop’s because earnings are terrible, that’s bad (reflects real damage). If it’s because of profit-taking after weeks of gains, that’s just normal. Reason matters more than direction.
Can I make money from daily Dow movements?
Theoretically yes, practically no for most people. Transaction costs eat returns. Tax inefficiency kills gains. You’ll probably lose because timing’s hard and emotions interfere. Buy and hold beats day trading 90% of the time.
Where should I get my Dow information?
Reuters, Bloomberg, WSJ, CNBC are decent. Skip Reddit, Twitter stock accounts, and random financial “gurus.” Read earnings transcripts yourself. Check the Federal Reserve’s website directly. Do your own thinking.
That’s the real story behind Dow Jones today and how to actually use that information. The number itself doesn’t matter nearly as much as the reasons behind it. Develop the habit of asking “why?” before you react. That single question separates people who build wealth from people who get pushed around by market noise.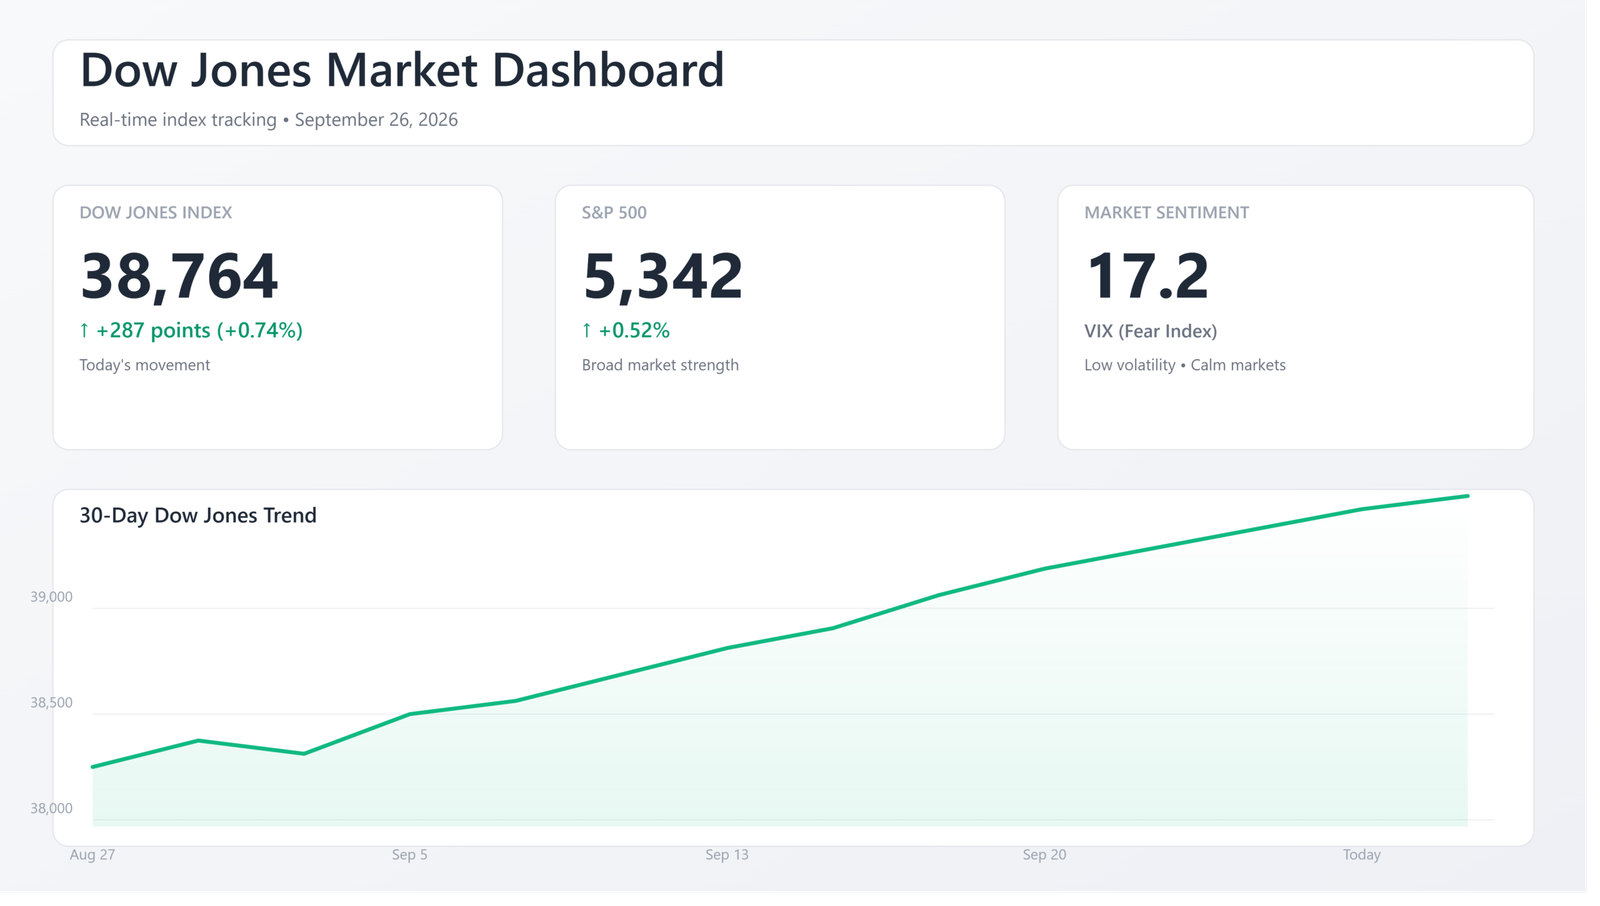
The markets will keep moving. Some days up, some days down. Your job isn’t predicting tomorrow—it’s having a solid strategy and not breaking it when things get weird. Most people who fail at investing fail at the emotional part, not the analytical part.
Stay curious. Question the headlines. Do your own thinking. And remember: today’s market movements are mostly noise in the grand scheme of building long-term wealth.